This is a practical how-to guide on best practices for debugging code in Julia using the Gallium package. We explore two methods: REPL and Juno-Atom.
Installation
To use the debugger Gallium in Julia 0.6+, the following packages should be installed: Gallium and ASTInterpreter2.
julia> Pkg.add("Gallium")
julia> Pkg.clone("https://github.com/Keno/DebuggerFramework.jl")
julia> Pkg.clone("https://github.com/Keno/ASTInterpreter2.jl")
There are two possible ways to debug with Gallium, by using:
- REPL
- Juno-Atom
REPL Debug mode
To use the debug mode in the REPL, it is first necessary to call Gallium or ASTInterpreter2 module. (This step can be skipped in the Juno REPL.)
julia> using Gallium
or
julia> using ASTInterpreter2
To start the debugging mode, you need to use the macro @enter followed by a command, but not a statement. For example, @enter 1+2 launches the debugging process, but the statement @enter var=3 will give this error:
ERROR: AssertionError: arg isa Expr && arg.head == :call
Stacktrace:
 [1] macro expansion at /home/user/.julia/v0.6/src/repl.jl:118 [inlined]
 [2] anonymous at ./<missing>:?
In the case, you want to debug a code in a file (e.g. a function…), it is first required to load and evaluate the source code. For that, you have to use the function include with the path of the source file. In the following example, we created a file called myFile.jl:
julia> include("/home/user/where/is/myFile.jl")
Next, you need to run the command @enter plus the name of a function to launch the debug mode. In our file myFile.jl, we created a function named magic(n::Int64) that return a magic square of order n (i.e. a matrix of size n x n).
julia> @enter magic(3)
    In magic(n) at /home/user/where/is/myFile.jl:49
 -> 49  if n == 1 || n == 2 || !isinteger(n) || n <= 0
    50          println("Error - Input must be an integer great or equal to 3.")
    51  elseif rem(n,2) == 1

    About to run: (==)(3, 1)
    1|debug >
Once in debug mode, you have access to the following basic and advanced commands:
Basic Commands:
- n steps to the next line
- s steps into the next call
- finish runs to the end of the function
- bt shows a simple backtrace
- `stuff runs stuff in the current frame’s context
- fr v will show all variables in the current frame
- f n where n is an integer, will go to the n-th frame*
Advanced commands:
- nc steps to the next call
- se does one expression step
- si does the same but steps into a call if a call is the next expression
- sg steps into a generated function
Help
You can always display this debugging list of commands by typing ?:
1|debug > ?
Step to the next call
Once in debug mode, you can read what is the next call that is about to run. You can step to the next call by typing nc. In the previous example, you were About to run: (==)(3, 1), which means to compare the value of n (in magic(n)) to 1. Therefore, typing nc gets you to the next call, in the same line code (49), which is about to compare n to 2:
1|debug > nc
    In magic(n) at /home/user/where/is/myFile.jl:49
 -> 49  if n == 1 || n == 2 || !isinteger(n) || n <= 0
    50          println("Error - Input must be an integer great or equal to 3.")
    51  elseif rem(n,2) == 1

    About to run: (==)(3, 2)
    1|debug >
Step to the next line
If you want to go directly to the next executable line, you have to type n. From the previous example, by typing n you run line (49) and pause at the first call in line (51):
About to run: (==)(3, 1)
    1|debug > n
    In magic(n) at /home/user/where/is/myFile.jl:49
    49  if n == 1 || n == 2 || !isinteger(n) || n <= 0
    50          println("Error - Input must be an integer great or equal to 3.")
 -> 51  elseif rem(n,2) == 1
    52      p = (1:n)
    53      M = n * mod.(broadcast(+, p', p - div(n+3, 2)), n) + mod.(broadcast(+, p', 2p - 2), n) + 1

    About to run: (rem)(3, 2)
    1|debug >
Steps into the next call
You can also step into a call by typing s. In the previous example, you were About to run: (rem)(3, 2), and you step into the function rem(3, 2) such as:
About to run: (rem)(3, 2)
    1|debug > s
    In rem(x, y) at int.jl:183
 -> 183   rem(x::T, y::T) where {T<:BitSigned64} = checked_srem_int(x, y)
    184   div(x::T, y::T) where {T<:BitUnsigned64} = checked_udiv_int(x, y)
    185   rem(x::T, y::T) where {T<:BitUnsigned64} = checked_urem_int(x, y)

    About to run: (checked_srem_int)(3, 2)
    1|debug >
To display all variables and their value in the current frame, you need to type fr v:
About to run: (checked_srem_int)(3, 2)
    1|debug > fr v
    [1] rem(x, y) at int.jl:183
      | x::Int64 = 3
      | y::Int64 = 2
      | T::DataType = Int64
    1|debug >
Show a simple backtrace
You are able to get some backtrace of the different variables in the different frames by typing bt. In the following example, the number inside the bracket [ ] indicates the number of the frame. You can see the names and the values of all variables for all active frames. The frame number [1] is always the current frame and the frame with the greater number is from where you step into a call, here it was the call rem(3, 2) in frame [2] in the following example.
About to run: (checked_srem_int)(3, 2)
    1|debug > bt
    [1] rem(x, y) at int.jl:183
      | x::Int64 = 3
      | y::Int64 = 2
      | T::DataType = Int64
    [2] magic(n) at /home/user/where/is/myFile.jl:49
      | n::Int64 = 3
      | #temp#::Bool = false
      | #temp#::Bool = false
      | #temp#::Bool = false

    1|debug >
Go the n th frame
Let’s say you have more than 1 frame, and you want to go to a previous frame, then you can type f n where n is the number of the frame. In the previous example, we got 2 frames; to go to frame [2] you should type f 2:
1|debug >  f 2
    In magic(n) at /home/user/where/is/myFile.jl:49
    49  if n == 1 || n == 2 || !isinteger(n) || n <= 0
    50          println("Error - Input must be an integer great or equal to 3.")
 -> 51  elseif rem(n,2) == 1
    52      p = (1:n)
    53      M = n * mod.(broadcast(+, p', p - div(n+3, 2)), n) + mod.(broadcast(+, p', 2p - 2), n) + 1

    About to run: (rem)(3, 2)
    2|debug >
To return to the frame [1], you simply have to type f 1:
About to run: (rem)(3, 2)
    2|debug > f 1
    In rem(x, y) at int.jl:183
 -> 183   rem(x::T, y::T) where {T<:BitSigned64} = checked_srem_int(x, y)
    184   div(x::T, y::T) where {T<:BitUnsigned64} = checked_udiv_int(x, y)
    185   rem(x::T, y::T) where {T<:BitUnsigned64} = checked_urem_int(x, y)

    About to run: (checked_srem_int)(3, 2)
    1|debug >
Run to the end of function
To run to the end of a function (or a call), you simply type finish. In the example below, by typing finish you run to the end of rem(3,2), and come back to the location from where rem(3, 2) was called, line (51) in myFile.jl.
1|debug > finish
    In magic(n) at /home/user/where/is/myFile.jl:49
    49  if n == 1 || n == 2 || !isinteger(n) || n <= 0
    50          println("Error - Input must be an integer great or equal to 3.")
 -> 51  elseif rem(n,2) == 1
    52      p = (1:n)
    53      M = n * mod.(broadcast(+, p', p - div(n+3, 2)), n) + mod.(broadcast(+, p', 2p - 2), n) + 1

    About to run: (==)(1, 1)
    1|debug >
Run stuff in the current context of the frame
It is possible to check out the value of any constant or variable in the current frame’s context, or even to write some commands in Julia while you are still in debug mode by typing the character back-tick ` . To go back in debug mode, you simply press on backspace (or delete for Mac users) in an empty line. In the example just above, let’s say that you run the code up to the line [54], and you want check out that the variable M is indeed a magic matrix, in other words if the sum of elements of each row, each column and the diagonal are all equals. Therefore, you need to type ` and run the following commands:
About to run: (ctranspose)(1:3)
    1|debug > n
    In magic(n) at /home/user/where/is/myFile.jl:49
    51  elseif rem(n,2) == 1
    52      p = (1:n)
    53      M = n * mod.(broadcast(+, p', p - div(n+3, 2)), n) + mod.(broadcast(+, p', 2p - 2), n) + 1
 -> 54      return M
    55  elseif rem(n,4) == 0
    56          M = collect(reshape(1:n^2,n,n))'

    About to run: return [8 3 4; 1 5 9; 6 7 2]
    1|debug > `
About to run: return [8 3 4; 1 5 9; 6 7 2]
    1|julia > sum(M,1)
    1×3 Array{Int64,2}:
     15  15  15

    1|julia > sum(M,2)
    3×1 Array{Int64,2}:
     15
     15
     15

     1|julia > trace(M)
     15

     1|julia >
Advanced Commands
From the help menu, there are four advanced commands. We have already discussed about nc to step to the next call. se and si are used to go through the lowest primal step of everything which is interpreted. And sg can be useful to step into a generated function.
Juno-Atom Debug mode
An alternative interface for debugging is the debug mode in Juno-Atom. By assuming that you have already installed Juno-Atom, there is no need to call Gallium or ASTInterpreter2 from the REPL in Juno-Atom. Gallium is initialized by default when Juno-Atom starts. However, it is necessary to load and evaluate the source code to debug a code in a file (e.g. a function…):
julia> include("/home/user/where/is/myFile.jl")
and from the REPL you launch the debug mode with @enter plus the name of a function. For example, in our file myFile.jl, we created a function named magic(n::Int64) that return a magic square of order n (i.e. a matrix of size n x n).

Once you enter into the debug mode, a debugging console appears at the top of your code with five blue buttons. The line where the program is paused is highlighted, for example in the figure above it is the line (49). In addition, at the end of the highlighted line, the statement after the blue bar indicates the next call that is about to run; in the example just above ==(3, 1) is about to run.
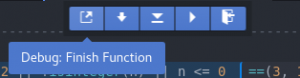
The first button allows you to run to the end of a function (or a call).
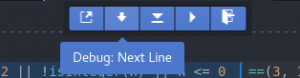
The second button steps to the next executable line, simlarly to n in the REPL mode.
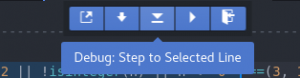
The third button acts in the same way to stop to a breakpoint. Basically, you can set a “breakpoint” just by clicking anywhere on the line of code where you want to program to pause. This line in should become highlighted, then click on the third button of the debugging console to stop at the selected line (i.e. breakpoint). The selected line has to be in the current frame. This command is not available in the REPL mode.
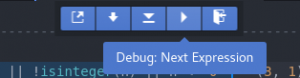
The fourth button steps to the next call, simlarly to nc in the REPL mode.
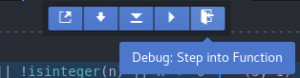
The fifth button steps into the next call, simlarly to s in the REPL mode.